I want my students to be able to create in the same manner I can create if not better. Just like when we teach our students that some tools work better than others in certain situations (ex. when to use a bar graph instead of a line graph), I want them to know that some digital tools work better than others in certain situations (ex. creating a budget using a Sheets vs Docs). But again, I found myself asking the same question I asked myself in my first blog . . . "Where do I start?"
One of the best places for me to start was a combination of Kristina Smekens' philosophy of giving students a choice in how they want to present their knowledge and Rozlyn Linder's philosophy of building charts to enhance understanding. Mixing these philosophies together and then adding the ingredient of GAFE gave me what I felt I needed to get the ball rolling.
I need to briefly give some background by explaining how our particular math series at my grade level jumps right in with operations using decimals. One of the biggest complaints and struggles I see is students trying to remember what to do when. For example, one has to line up the decimals when adding and subtracting, but can basically ignore them for a while in multiplication. Knowing when, where, and why to move the decimal in a division problem adds a whole new level to the complexity of it all.
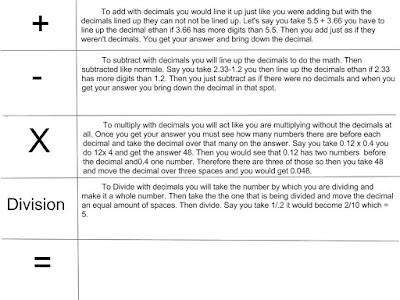
This situation presented an opportunity to truly assess the student's understanding by having them create what I called "Visual Aids for Decimals." They were challenged to think like a teacher and create a graphic organizer or chart which would help their students understand the operations of decimals. They were given freedom to choose any of the GAFE applications they felt was their best choice to complete this task.
I was very pleased with the results as they not only showed the student's creativity and gave them the experience with the tools, but it also gave me a quick snapshot of the area of need (in our case dividing decimals) so I could reinforce the instruction.
Below are some samples of what was submitted:


Love the idea of allowing students the opportunity to choose the way that they can show understanding. It leaves the door wide open for their creative minds to come up with some outstanding answers.
ReplyDeleteGreat example of digital literacy and the power of choice. We learn by doing and our kiddos are no different than adults. Love how you model lifelong learning and do this WITH your students.
ReplyDelete